
The Totally Fake Inflation Numbers
 The Totally Fake Inflation Numbers
 Going by the government’s official numbers, the inflation rate is 3.4%. But if the numbers were run the way the government ran them in 1980, it would be 11.4%.
This is why, when we mention the consumer price index each month, we typically say, “Any resemblance between these numbers and your actual cost of living is purely coincidental.”
For many years, an economist named John Williams has, in fact, run the numbers the way the government ran them in 1980. (And not just inflation, but also unemployment and GDP.)
His firm called Shadow Government Statistics supplies these figures to a slew of clients so they can make more realistic decisions with their investments and businesses.
He doesn’t do a lot of interviews. But he popped up last weekend on the venerable Financial Sense podcast.
“Starting in 1980, there have been about 20 changes” to the way CPI is calculated, said Mr. Williams.
“Every change has lowered the CPI compared to how it would have been calculated before.”
As you might recall if you were around then, inflation felt out of control in late 1979 and early 1980.
The peak was a staggering 14.6% in March 1980 — when Pink Floyd topped the charts with “Another Brick in the Wall, Part II” and Dustin Hoffman was the big box office draw in Kramer vs. Kramer.
Key point: Inflation rates that high threatened to destroy the Social Security program in short order: No way could it keep up with cost-of-living adjustments that steep.
And so began that process of 20 changes in the way the official inflation rate is calculated, every one of them bringing the number down.
We mentioned two of the most egregious only last week, but we’ll reinforce them here…
- Hedonic adjustments. If the price of a new car goes up, but the manufacturers add new features to the new models, well then the price of a new car hasn’t really gone up, has it?
- Substitution. If you start buying hamburger because steak is too expensive, well, your price of beef hasn’t really gone up, has it?
There’s still another trick called “geometric weighting” — in which prices of things that are going up are given proportionally less weight in the index than prices of things that are going down.
You can’t make this stuff up. But the economists at the Labor Department do!
“They're not fooling the average person. The average guy has a good sense of how he’s doing; that's always the case. They're not keeping up,” Williams said.
“They know it and they vote their pocketbooks. You can fudge a number, but fudging the numbers isn't going to help you at the polls.”
Word. A rising cost of living handed Republicans the House of Representatives in 2022. A rising cost of living handed Donald Trump the presidency in 2024. A rising cost of living will likely hand the House back to Democrats in 2026.
And so it goes when no one in Washington will take responsibility for getting federal spending back under control.
This chart’s been making the social-media rounds this week…
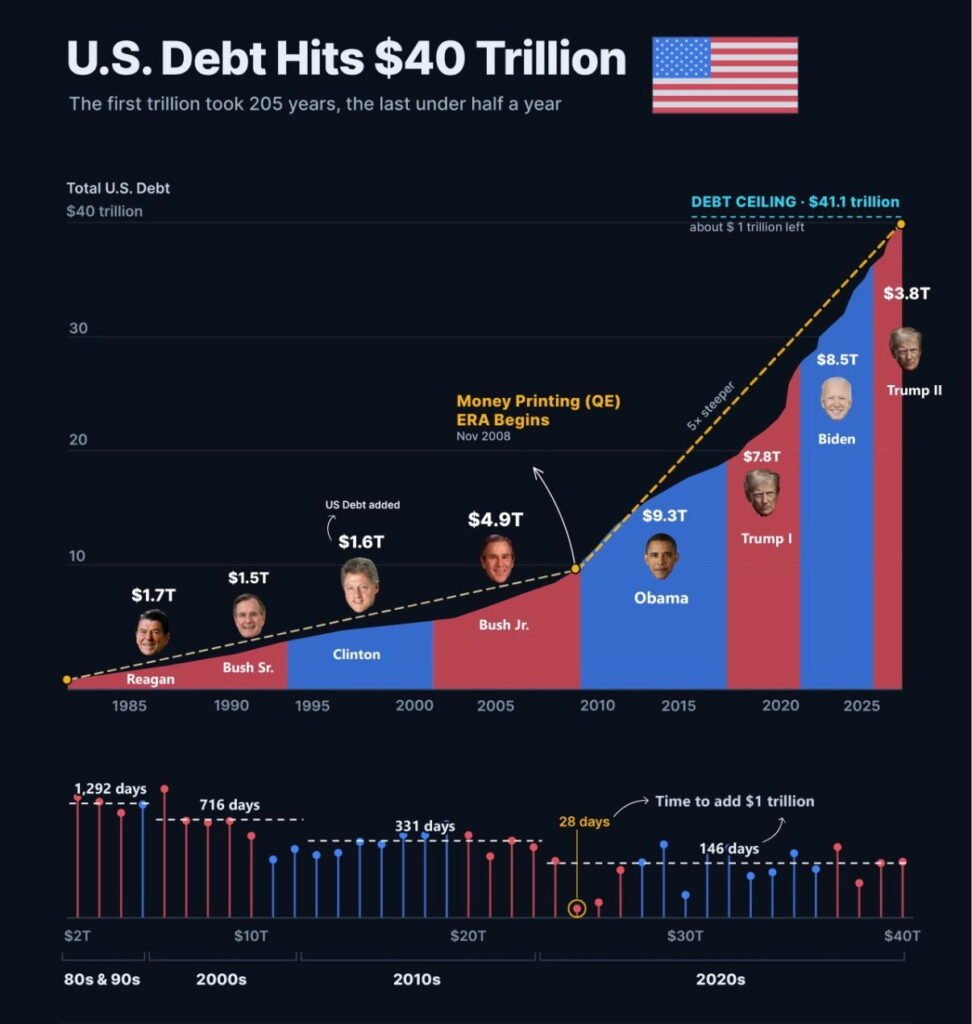
Notice how the national debt began soaring toward the end of Trump’s first term with the mad COVID spending. It’s an even steeper trajectory than during the aftermath of the 2008 financial crisis.
That’s why inflation has been ruling your life for the last five years — and if history is any guide, will continue to do so into the early 2030s.
How to cope? Well that dovetails nicely into Bullet No. 2…
 The Road to Gold $10K (Updated)
The advent of $10,000-an-ounce gold has not been prevented. Only delayed.
In mid-December last year Paradigm’s macroeconomics authority Jim Rickards said in this space that “it’s entirely reasonable to suggest gold could reach $10,000 per ounce by late 2026 — on its way much higher.”
The forecast was looking more than plausible a few weeks later — gold soaring from $4,300 at the start of January to over $5,500 by the end.
But the move was an obvious case of “too far, too fast.” The Midas metal experienced two sharp sell-offs on the way to a $4,000 summertime bottom. Still, that $4,000 level held fast and we’ve been over $4,600 both today and yesterday.
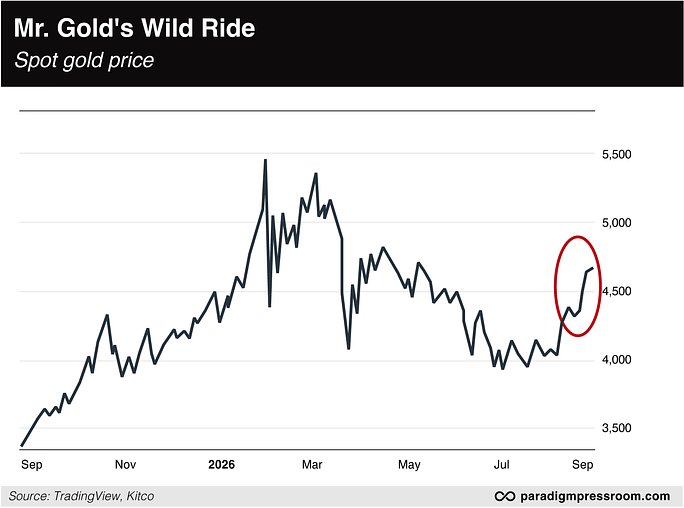
Looking back, the big drop “has an obvious cause,” Jim wrote his Strategic Intelligence readers on Friday.
“Oil prices went from $60 per barrel to $110 per barrel between late February — at the start of the war in Iran — and early April, before talk of a ceasefire and the Memorandum of Understanding (MOU) between Iran and the U.S. took hold.
“Every country in the world needs oil, and oil is priced in dollars. That means everyone needs dollars. And one of the fastest ways to get dollars is to sell gold.”
So, is the bottom in? And is $10,000 still realistic?
Apologies if you’re a longtimer and you’ve heard the story before — but a little over a decade ago, Jim met up in the Dominican Republic with the legendary commodities trader and world traveler Jim Rogers, author of Investment Biker and Adventure Capitalist.
“No commodity goes to the moon without a 50% drawdown along the way,” Rogers said. “That’s just how it is. If you’re not prepared for that or can’t deal with that, then you’re in the wrong business.”
Consider that gold began this century around $250 — peaking at $1,900 in 2011. That’s a $1,650 jump. Half that figure is $825.
“Therefore,” says Jim Rickards, “a 50% retracement of the gain from $250 to $1,900 would yield a new bottom of $1,075 per ounce.”
As it happens, Jim originally related the Rogers encounter in this space in December 2015. The actual bottom came that month at almost exactly that figure, $1,050.
So let’s apply the “Rogers retracement rule” to gold now. (Here, Jim Rickards relies on the front-month futures contract, which is a little different from the chart above.)
“A few months ago,” Jim says, “I took gold’s January high of $5,400 per ounce and its prior low of $1,650 in October 2022. That’s a gain of $3,750. Half of that gain is $1,875, which produces an expected bottom of $3,525.
“The actual bottom? About $3,990 on July 16, 2026.
“That’s not as close as Rogers’ original forecast, but it’s close enough to be meaningful given the magnitude of gold’s recent collapse.”
With that, Jim forecasts that investors “can now buy gold with some confidence that we’re in a new takeoff stage and $10,000-per-ounce gold is the new destination.”
 Economic Warfare Update
U.S. oil futures are down nearly three bucks to $82.10 because…

Really?
Why would Washington make a mild peace overture the day after Treasury Secretary Scott Bessent unleashed “Economic D-Day” on Iran?
Except, if you were paying attention, he didn’t. No new sanctions actually kicked in yesterday. Instead, Bessent said he and the president and other top officials are making phone calls to other governments to spell out demands about how those nations should cease trade with Iran.
The details about who’s being called and what’s being demanded and what consequences will follow if they don’t follow orders are… well, thin doesn’t even begin to describe it.
The only thing we know with certainty is that several Chinese banks are in the crosshairs.
Of course, Beijing won’t take kindly to that. For now, however, the Chinese government is keeping its words measured.
“China calls on parties to act rationally and with restraint and avoid taking any measures that may further escalate tensions or deal a blow to global economic growth and financial stability,” says a spokesman for the foreign ministry.
As for the stock market today, the major U.S. indexes are back in the green — but not much.
At last check the S&P 500 is up a third of a percent to 7,674. The Nasdaq is up a half percent, while the Dow is just barely positive on the day.
Precious metals are consolidating their recent gains — gold at $4,643 and silver at $68.62. Bitcoin has surpassed $79,000 but Ethereum has pulled back below $2,500.
 Comic Relief
The evolution of the economy, as seen by one especially cynical observer…

 Mailbag: Data Centers, Uncle Sam’s Interest Expense
On the subject of data centers and public perceptions, we heard from a lawyer in northwest Indiana…
“Having presented data center developments to shall we say unenthusiastic crowds (understatement), I know, firsthand, the vitriol producing the headwinds in communities.
“From my experience, much of the response is grounded in the worst examples from a few data centers and does not comport with what data centers are now becoming. But with local elected officials and their families facing an onslaught of personal attacks, it is understandable that the narrative has eliminated rational discourse in many areas.
“However, I’m starting to see a below-the-headlines change that is worth noticing. In the past few weeks, I have received requests for my group to consider development in communities with existing industrial infrastructure to help provide financial support that is becoming more acutely needed as a result of state government shifting financial burdens to municipalities in my area of the world.
“Also, when compared with steel or other industries or vacant brownfields, data centers are environmental wins. These days, data centers, while perhaps receiving some financial incentives, largely must pay ‘tolls’ to enter any community in the form of direct incentives that far exceed any other use a municipality could bring in to shore up the balance sheet (often a remarkable windfall that provides dividends well into the future that will enable those communities to level up for residents).
“And the weight of the leverage is with the municipality such that the municipality can insist on the highest levels of available technology to eliminate or highly ameliorate the issues that have framed the data center discussion.
“I thought I’d put this on your radar for the future. Appreciate your messages.”
To our second and final correspondent today: “You may have covered this before, but would really like to hear your perspective on what happens to our economy when (we all know that it is not if) the interest expense on the national debt becomes the No. 1 line item expense in the federal budget.
“Really love your stuff!!”
Dave responds: We’re a ways away from that juncture if you go by the Treasury Department’s latest monthly statement.
We direct your attention to the right side of this graph, covering the first 10 months of fiscal year 2026 — i.e., through July 31.
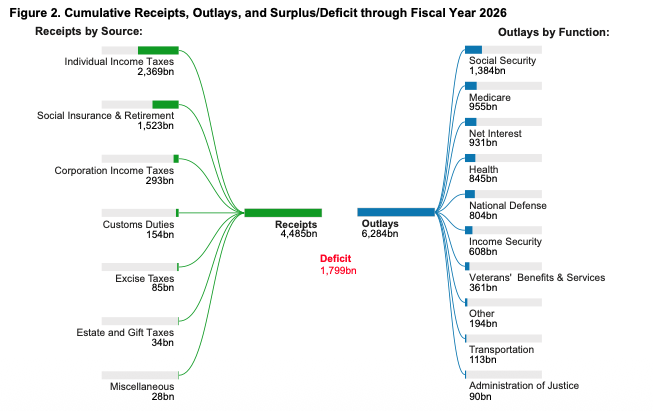
But your question is still highly relevant as interest expense on the debt continues to swell.
Short answer: The more money Uncle Sam has to borrow, the less money is available to the private sector to borrow so it can expand operations, hire people and so on.
This is the so-called “crowding out” effect.
If the concept is new to you, that’s because it hasn’t been an issue for many decades. Interest rates fell steadily from the 1980s through the 2010s.
During Barack Obama’s presidency, the national debt rose relentlessly — but because interest rates sat near historic lows, the annual cost of financing that debt registered a slight decline.
But those days are over. We’re in a new 40-year cycle of rising rates that began in 2020 when the yield on a 10-year Treasury note was a paltry 0.5%. (It’s 4.66% this morning.)
That’s why the federal government’s annual interest expense doubled between fiscal years 2022–2025.
Again, Uncle Sam’s ravenous need to borrow more and more deprives the private sector of the funds it needs to grow and thrive.
And wouldn’t you know it, this is happening at the very moment the AI industry needs to borrow gobs of money to build data centers and other infrastructure.
But that’s a story for another day…


