Widespread Panic
![]() “Be Right and Sit Tight”
“Be Right and Sit Tight”
 After a brief respite, Mr. Market is getting jerked around again by trade-war headlines.
Yesterday was the first “calm” day in the markets since late March – in the sense that the benchmark S&P 500 didn’t move more than 1% either up or down all day. (It ended the day down 0.4%.)
But checking our screens this morning, the S&P is down 1%... the Nasdaq down nearly 2%... and AI darling Nvidia down nearly 7%.
We’ll hold off on the whys and wherefores until our Bullet No. 3 – because while these developments might be urgent, there’s something more important to consider.
What’s more important today is an expression attributed to the legendary trader Jesse Livermore — “be right and sit tight.”
Livermore was the basis for the main character in Edwin Lefèvre’s 1923 book Reminiscences of a Stock Operator.
In one of the book’s most famous passages, the Livermore character talks about riding out episodes of market turbulence. “Men who can both be right and sit tight are uncommon,” he said.
“I found it one of the hardest things to learn. But it is only after a stock operator has firmly grasped this that he can make big money… After spending many years in Wall Street and after making and losing millions of dollars I want to tell you this: It never was my thinking that made the big money for me. It always was my sitting. Got that? My sitting tight!”

Jesse Livermore: 1877-1940
Over a century later, amid the current market turbulence, Paradigm trading pro Enrique Abeyta has updated Livermore’s guidance for a new audience: “DO. NOT. SELL.”
“The selloff we’re living through isn’t just a threat; it’s also an opportunity,” he says — “one that only happens once every five years, on average.”
We’ll get to the opportunity soon enough. First, here’s a chart Enrique shared on social media the other day.
“It shows that if you missed out on being fully invested for the best one-day moves in the stock market over the last 30 years, your returns would be one-sixth of what they could have been.”
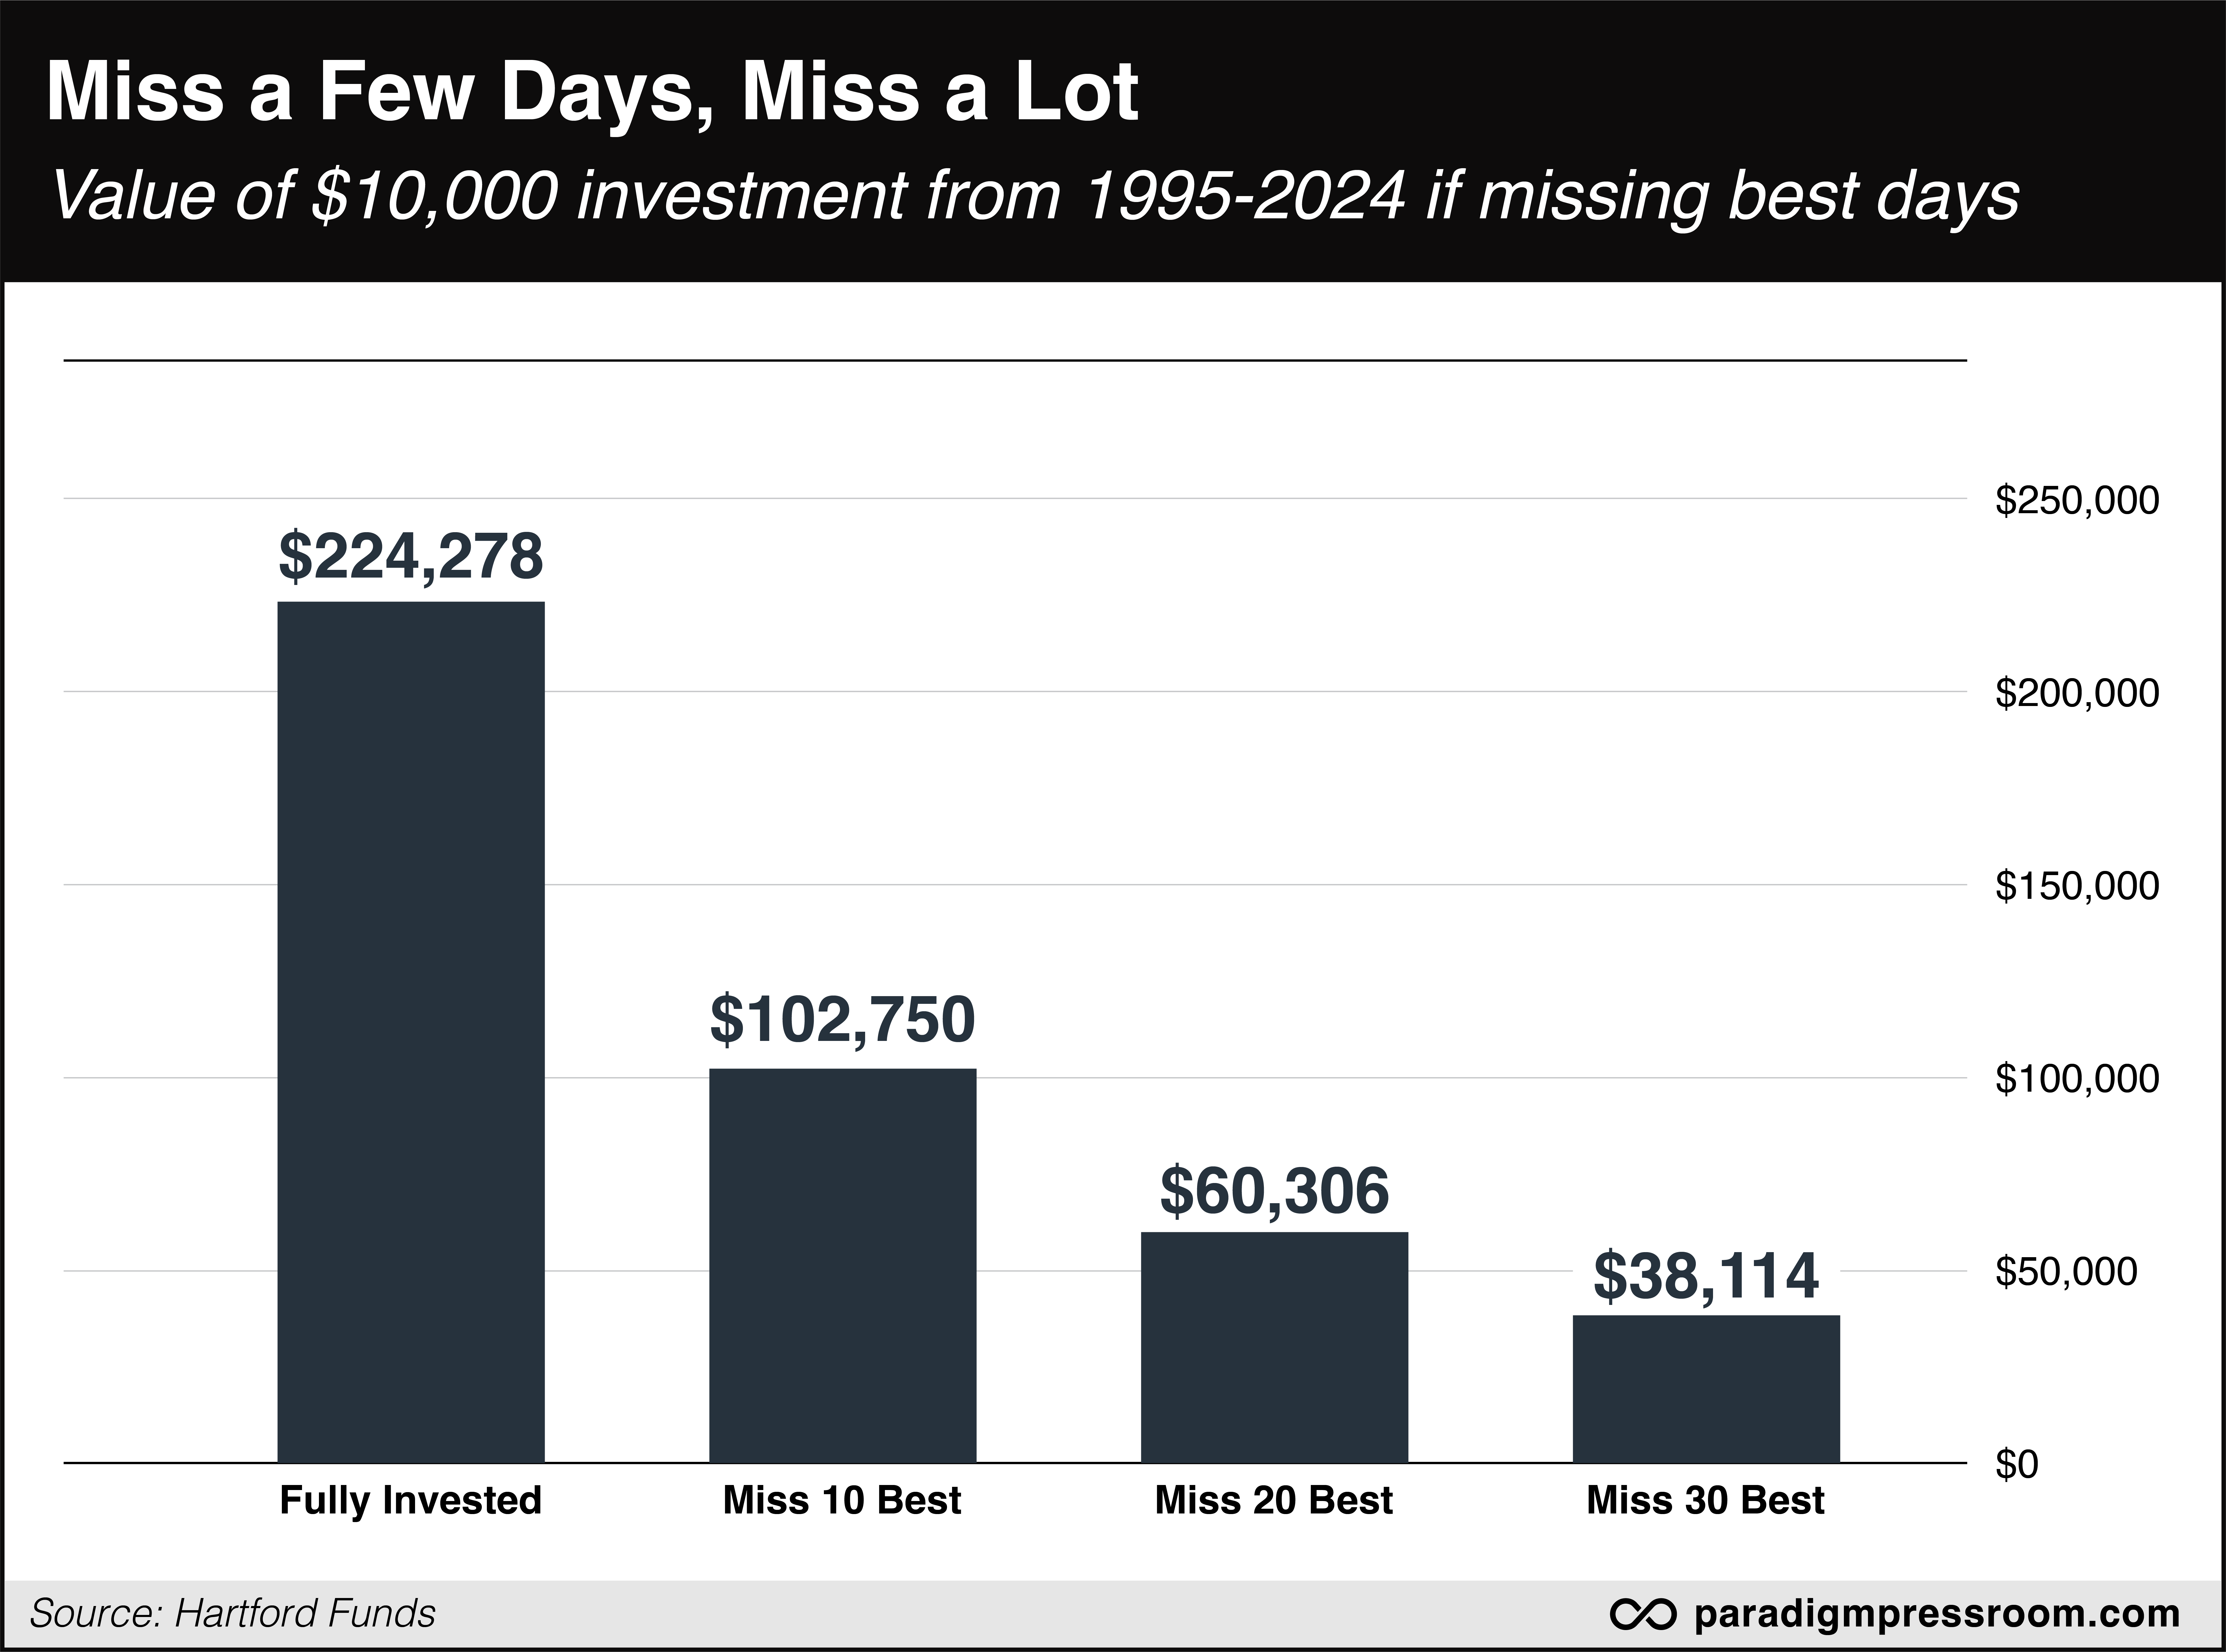
Yup. Miss the best 30 days out of the last 30 years, and your returns are slashed by 83%.
“The tricky part is that almost every one of those big one-day moves happened during stock market selloffs,” Enrique says.
Like the one we’ve been going through this spring.
But here’s the thing: “These types of selloffs only happen roughly once every five years,” he tells us. “And they present an opportunity to not only preserve your financial future but also magnify it — without adding any more risk to your portfolio. In fact, you will actually reduce the risk of your portfolio.
“So how do you do it? The strategy is to upgrade your holdings,” Enrique continues.
“During a bull market, most stocks get more expensive. The best businesses trade to very high valuations. Many stocks also become overbought, leaving them vulnerable to corrections. This is exactly what is happening in the stock market right now.
“Bull markets are also periods of stability, which means you can take on more risk. As long as stocks are trending higher, buying lower quality and more leveraged companies makes a lot of sense and can produce great reward.
“The right combination of high-quality companies and riskier positions can create a portfolio that will excel in a bull market.
“But when the market corrects, the equation changes. Lower-quality companies go from some of the best trades in your portfolio to some of the riskiest. Meanwhile, some of the best companies in the world trade to valuation levels that we might never see again.”
Here’s an upgrade Enrique says is ideal for the present moment: Sell quantum-computing phenom Rigetti Computing Inc. (RGTI) and buy Google parent Alphabet (GOOG).
RGTI rode the wave of interest in quantum computing over the last six months – sending the share price shooting from under $2.50 around Thanksgiving to near $20 just after New Year’s Day.
For a company with no revenues or profits, that’s fine during a bull market. “But continuing to hold this kind of stock is exactly the wrong move to make once we enter a period of heightened volatility,” Enrique says. He sees RGTI easily sinking back to $1 in a bear market – where it was trading six months ago.
Meanwhile, the valuation on GOOG is starting to look quite reasonable – a price-earnings ratio of 15 – after its share price sank from $200 in early January to under $160 now.
“Not only is this much cheaper than the overall stock market,” Enrique says, “but it is also cheaper than the long-term average of the S&P 500.”
Again, this sort of opportunity shows up only once every five years or so. “You won’t get this window again soon,” Enrique says. “Don’t waste it.”
![]() A Bang-On Stock Market Indicator
A Bang-On Stock Market Indicator
If Enrique’s guidance isn’t enough to persuade you to “be right and sit tight,” consider this.
There’s a stock-market indicator with a perfect track record going back more than 30 years. It’s the CBOE Volatility Index – or in market parlance, the VIX.
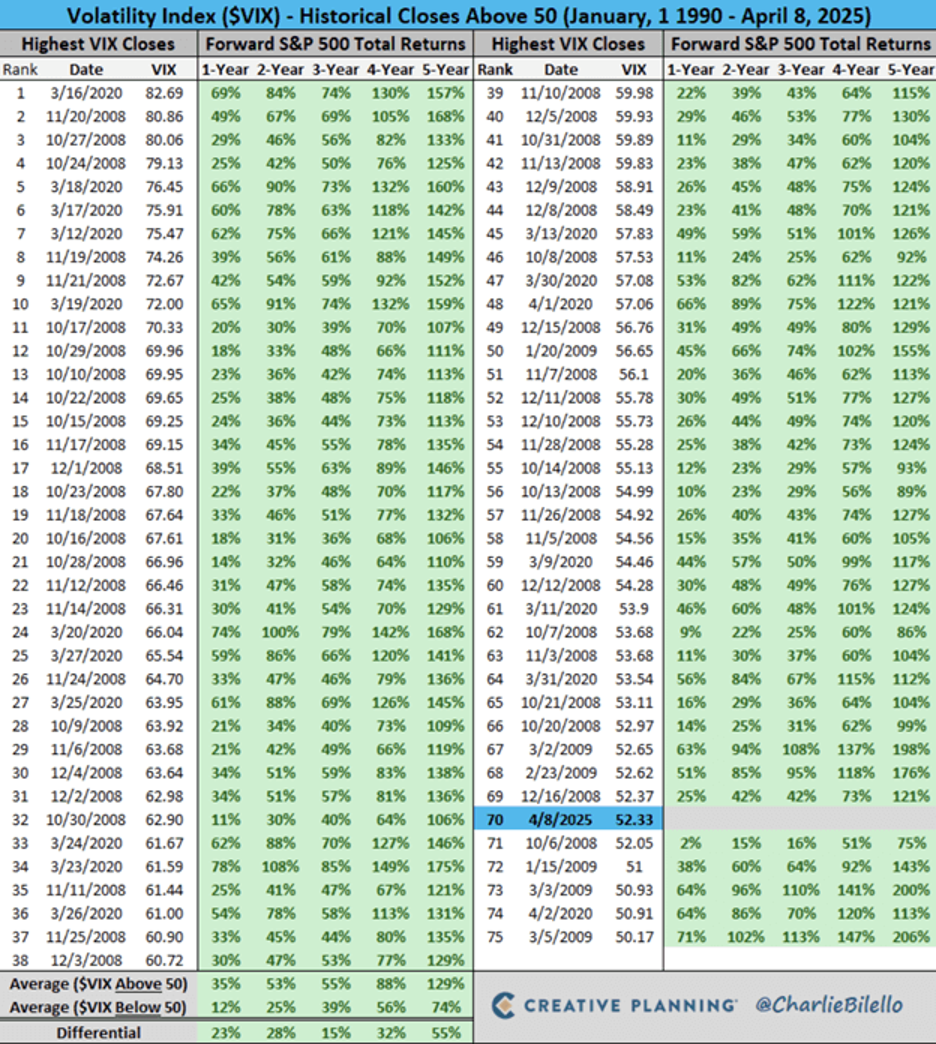
“Recently,” says Davis Wilson at our sister e-letter The Million Mission, “the VIX closed above 50 for the first time since April 2020, a rare event that has historically been a golden signal for long-term investors.
“Data shows that every single time the VIX has closed above 50 since 1990 — a perfect track record spanning 75 occurrences — the S&P 500 has been higher 1, 2, 3, 4, and 5 years later.
Uncanny, huh?
LOGO – We talk periodically in this space about the VIX. Today’s a good day to revisit exactly what it is.
“The VIX measures the market’s expectation of volatility over the next 30 days, derived from the implied volatility of S&P 500 index options,” Davis says.
“In simpler terms, it reflects how much investors expect the market to swing, serving as a barometer of fear and uncertainty.
“A low VIX, typically between 10 and 20, indicates calm markets and investor confidence. A high VIX, especially above 30, signals growing unease, often coinciding with sharp declines in stock prices.
“When the VIX crosses 50, as it did last week, it reflects extreme panic – a level seen only during major crises like the 2008 financial meltdown or the 2020 COVID-19 crash.”
Back to that table: It’s not just that every time the VIX crosses 50, the market is higher 1 year later – and 2 years, 3 years, 4 years and 5 years later. It’s also the magnitude of the gain: On average, the index jumps 35% after one year… and 129% after five years.
Why is this indicator so reliable?
“When the VIX spikes above 50,” says Davis, “it typically reflects widespread panic, with investors selling stocks indiscriminately. This fear-driven selling pushes prices down, often below their intrinsic value, creating a buyer’s market.
“High-quality stocks get dragged down with the broader market, offering a rare chance to buy at a discount.”
[See GOOG in our Bullet No. 1 for an example.]
“But as fear subsides and the market stabilizes, stock prices recover, rewarding patient investors who bought during the chaos.
“The VIX’s perfect track record above 50 underscores this pattern: extreme volatility has always been a precursor to long-term growth.”
True, we’re looking at a limited data set – going back to 1990. “It doesn’t capture earlier market periods that might have behaved differently,” Davis concedes.
“Still,” he says, “the consistency of this signal is hard to ignore.”
Yesterday the VIX settled down to nearly 30, and it’s still there today. “But the current market volatility is far from over,” Davis says.
[We’ll get to the details momentarily.]
The VIX could easily soar over 50 again – and soon.
“When it does,” says Davis, “don’t panic. Buy.”
![]() Today’s “Headline-Driven” Market
Today’s “Headline-Driven” Market
With all of the preceding as context, let’s get to the “headline risk” that’s once again roiling the markets.
The trouble began last night when Nvidia disclosed that the Trump administration has slapped new controls on the sale of the company’s chips to China. Result -– a $5.5 billion hit to NVDA’s earnings.
Per the Financial Times, “The chipmaker said its H20 chip, which is already tailored to comply with Joe Biden-era export controls that prevent the sale of its most powerful chips in China, would now require a special licence to be sold to Chinese customers.”
Then came another blow to the chip sector: The Dutch giant ASML reported that orders during the first quarter fell 18% short of expectations — blaming the results on uncertainty over tariffs. “ASML,” Bloomberg reminds us, “is the sole producer of cutting-edge lithography machines used by semiconductor companies to make advanced chips for various products” — including Apple’s iPhones and Nvidia’s AI accelerators.
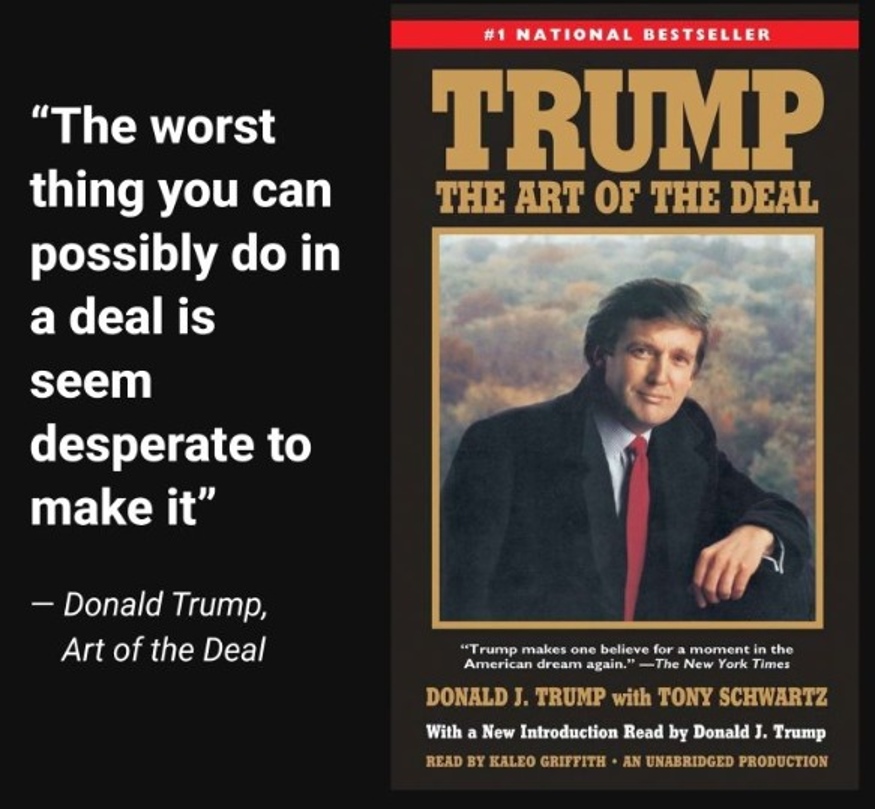
Elsewhere, Bloomberg reports that “President Donald Trump called on China to reach out to him in order to kick off negotiations aimed at resolving the escalating trade fight between the world’s two largest economies” — a development that’s generated a scathing reaction in the meme-o-sphere…
So those are the cross-currents as the stock market takes a minor tumble. At 5,330 the S&P 500 sits 6% below where it was before the president’s “Liberation Day” declaration on April 2.
![]()
$3,200 $3,300 Gold
Meanwhile, gold has soared to a stunning record high. Again.
After crossing the $3,200 threshold last Thursday, the $3,300 mark fell today. At last check, the bid is up $96 to $3,324.
Silver’s gain isn’t as strong, but it’s nothing to sneeze at — up 55 cents to $32.83. The mining stocks continue on their tear of late — the HUI index over 400 for the first time in 12 years.
As we said yesterday and last week, the rush into gold is the mirror image of the rush out of U.S. Treasuries. Colleague Sean Ring picks up on the theme in today’s Rude Awakening: “It’s not just about inflation or dollar weakness. It’s about trust in the system itself.”
That said, the bond market has settled down for the moment — the yield on a 10-year Treasury note is still around 4.32%.
Crude is up a buck to $62.34 – still on the low end of its trading range this month. Bitcoin is hanging tough just under the $85,000 mark.
As for the day’s big economic numbers, there are two…
- Retail sales as calculated by the Census Bureau leaped 1.4% from February to March. The mainstream is keen to attribute the jump to consumers snapping up merchandise before any tariffs kicked in — which makes us immediately suspicious that the explanation lies elsewhere
In any event, retail sales are up 4.6% year-over-year — a respectable showing considering this number is not adjusted for inflation and the official inflation rate is 2.4%..
- Industrial production as reported by the Federal Reserve slipped 0.3% from February to March, thanks to warm weather depressing utility output. Manufacturing output grew 0.3%.
All told, 77.8% of America’s industrial capacity was in use last month. For more than two years, this number has been mired beneath the 50-year average of 79.6%.
![]() Mailbag: What About the Dollar?
Mailbag: What About the Dollar?
“Your bond-sell off commentary is solid,” a reader writes after yesterday’s edition. “However, from where I'm looking I feel you've missed a major issue surrounding it.
“According to sources I've been reading, the sell-off is more than just a lack of confidence. It's also an intentional action meant to devalue the USD on the part of several of the countries that have been unloading U.S. treasuries. Y'know, like the currency wars that Rickards is always talking about, but accelerated a couple of levels.
“We all know how bad devaluation can be. Inflation, loss of capital investments and reduced purchasing power for all of us, for example.
“It also lessens the impact of retaliatory tariffs on their own consumers when they buy imports from the U.S.
“Oh, and it will make the cost of carrying debt domestically even MORE burdensome, to pile on your own take below.
“Am I missing anything here, or is this accurate? Does the administration realize this is happening? I think it was part of why they had to back down on the tariffs for 90 days. The economic decision making right now is mind-numbing and naive.”
Dave responds: I excluded the falling dollar from my analysis primarily because — unlike rising Treasury rates — the White House welcomes a falling dollar.
The U.S. Dollar Index — measuring the dollar’s value against a basket of six developed-market currencies — has tumbled from over 104 at the start of April to under 100 today.
That’s a huge move — and one that, all else being equal, the Trump administration wants because it makes U.S. exports cheaper for foreigners to buy.
Cheapening the currency to goose exports is the essence of currency wars, as Jim Rickards wrote in his book of that name in 2011. The currency war that Barack Obama launched in 2010 still has at least a couple of more years to run…
“I understand the idea of keeping the same time all year around,” a reader writes after my latest daylight saving time rant in Monday’s edition.
“I personally (and a vast majority of others that I have discussed this issue with) really like daylight saving time year round. I know that during the winter months I go to work in the dark and come home in the dark, and I am in the middle of the lower 48. I also know that when we lose DST, it is too dark to do anything outside after work.
“So, personally, I would either like DST all year or someone to change the ‘normal’ work hours from 7-4 or 6-3! LMAO. But I am just one person so....
“Enjoy your column and try to make it a point to read it every day. I especially like it when we disagree — makes me think of why I actually think what I think. Thank you.”
Dave: You just made my day — thank you!
Best regards,

Dave Gonigam
Managing editor, Paradigm Pressroom's 5 Bullets


")

")


